This week we’ve started looking at the data that’s come in so far. One of the things we wanted to check was what degree of coverage we had of the UK.
The answer is… rather pretty.
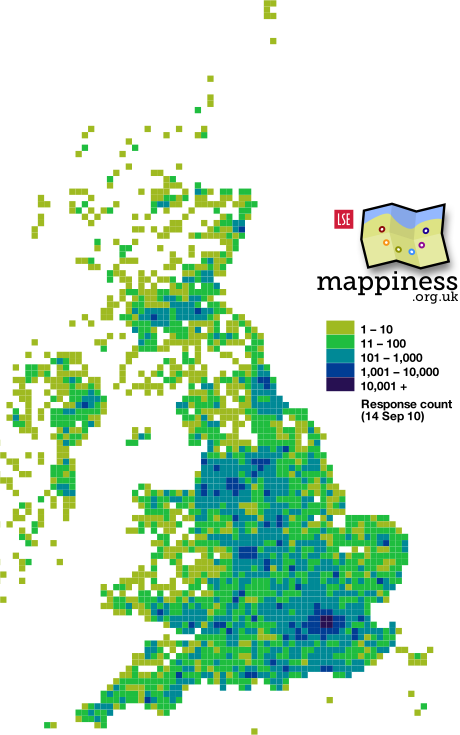
The map shows the number of responses per 10 × 10 km cell, as of 1.45am yesterday, shaded logarithmically (so that the threshold for using each colour is 10× the threshold for the previous colour).
Major cities are visible as spots of darker blue: see if you can identify Abderdeen, Glasgow, Edinburgh, Newcastle, Belfast, Swansea, Cardiff, Exeter, Plymouth and Brighton.
Update! See how our response coverage has changed over time.