
mappiness, the LSE project that maps happiness across the country using people’s iPhones, got a second big round of media exposure last week.
The reason? We let the Sunday Times have a few simple figures based on a snapshot of our data from the project’s first 6 weeks. We’d averaged the happiness levels reported by participants on different days of the week, and found that Tuesdays brought us the lowest average response, a whole 0.2% lower than Mondays.
These figures are illustrated below. Note that the vertical axis is zoomed right in on one part of the 0 – 1 scale.
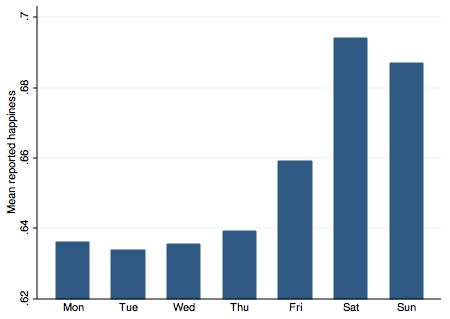
Mean UK happiness response by day of the week
Tuesday is the new Monday
We have about 100,000 data points behind each bar of this graph, and the drop from Monday to Tuesday is highly statistically significant.
But it is only the average happiness reported by some iPhone owners on different days of the week during a particular period. And it certainly isn’t the result of some large multivariate regression, trying to hold everything else constant (though we will, of course, be running such regressions in future).
It probably isn’t showing, therefore, some kind of pure effect of Tuesdayness. It might well reflect the fact that Mondays are sometimes Bank Holidays, random variations in the weather, and a lot of other factors.
Then again, maybe the explanation lies in a related snowclone. Searching Google for the 49 permutations of “[day] is the new [day]” puts “Monday is the new Friday” well ahead of the competition (see below).
And if Monday is the new Friday, isn’t it arguably natural that Tuesday should be the new Monday?
![Chart: number of Google results for quoted search terms of the form '[day] is the new [day]'](http://blog.mappiness.org.uk/files/2010/10/screen-shot-2010-10-19-at-19-oct-10-45-29.png)
Number of Google results for quoted search terms of the form “[day] is the new [day]”
Pingback: Frankie Roberto – The Tuesday Trough()