We officially launched mappiness just over three weeks ago. So far, it’s been successful beyond anything we dared hope for.
I originally wrote on our website that our target was to reach 3,000 users. I thought this goal would be more aspirational than realistic.
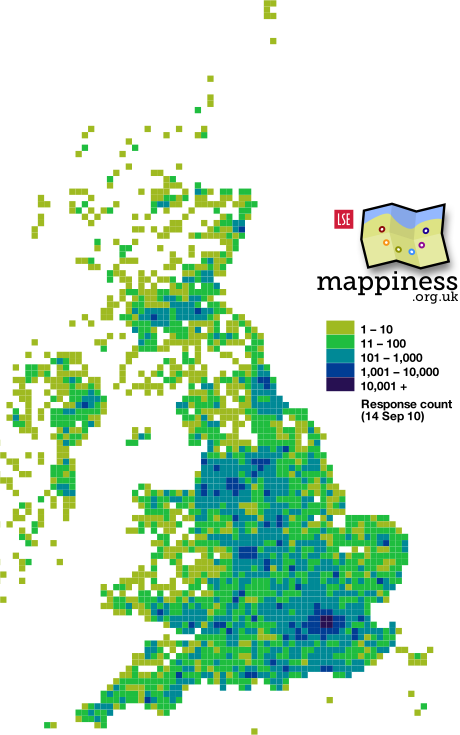
But as I write, we’ve recently signed up our 18,479th participant! We’ve just received our 386,980th happiness response alongside our 31,871st photo. And we’re currently sending the equivalent of over one million beeps per month.
So, here’s a massive thank you to everyone who’s signed up and generously let us know how they feel day after day after day. Massive, massive thanks to all of you.
How did we get here?
In the first few days it was thanks mainly to some serious tweeting and retweeting. Then we were lucky to get some great media coverage, including various UK newspapers, TechCrunch, blogs, and local radio.
We even had an item on prime-time CNN (you can catch that on our news page— unfortunately it’s Flash-only, so not for iPhones/iPads).
Then, and statistically best of all, we were featured in Apple’s UK App Store for two weeks straight.
How are we coping?
Having built the system in the expectation of well under 3,000 participants, it was nice to see it scale to 12,000 or so without a hitch.
But over the Bank Holiday weekend (28th – 30th August) it all got a bit much for our poor, overburdened database server. (I was driving and then taking a sleeper train across Europe for most of this time, and immensely frustrated at being unable to do anything about it).
By Monday afternoon everything was tweaked back to normal (techie interest only: we added indexes, cut down on transactions, and upped shared memory). But only after a really unfortunate 48-hour outage, for which we’re very sorry.
On a fingers-crossed-completely-unrelated note, the volume of beeps we’re now sending has required some significant further back-end tweakery, which went live last night.
We hope this will be completely transparent to participants, but if you notice anything awry please (a) let us know and (b) bear with us!
What have we found?
We’ve had literally no time so far to do any serious analysis of the data coming in, but we hope to get started on it soon. We’ll be keeping this blog updated with some of the details, so please subscribe if you’re interested.
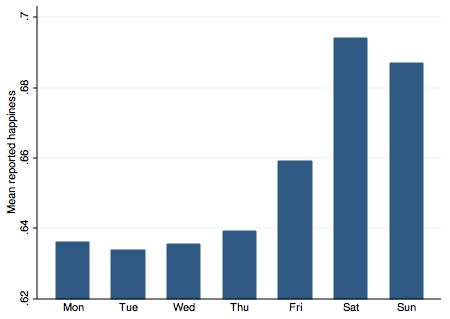
In the meantime, you may have seen on our hedonimeters the clear (and perhaps unsurprising) pattern that people are happiest at weekends and after work.
What’s next?
We want to keep mappiness going as long as people are happy to participate. We hope most people who sign up will stick with it for at least a couple of weeks, but there’s zero obligation. (You can take a break at any time—for an afternoon or forever—by opening the app, going to Settings, and choosing 0 as your Beeps per day).
We’ve had lots of requests for improvements, and we’ll be acting on most of them.
We certainly need some new entries for the activities list—we get asked to add Internet and email/chat-related activities several times a day!
We hope also to add the ability to save your photos to your iPhone photo album, and the option to be prompted for a photo every time, not just when you’re outdoors.
A bit longer-term, we want to provide the ability to dowload your raw data for analysis yourself, as well as analysing and presenting your data better within the app, probably with maps.
Further out still, we’re considering support for additional platforms (mainly Android) and more countries (particularly the US and Canada).
If you’ve got more ideas, please email us or (even better) contribute them in our feedback forum. And stay tuned!
![Chart: number of Google results for quoted search terms of the form '[day] is the new [day]'](http://blog.mappiness.org.uk/files/2010/10/screen-shot-2010-10-19-at-19-oct-10-45-29.png)